Average D.C. Metro Area Commute Lengths, 2016
 Average D.C. Metro Area Commute Lengths, 2016
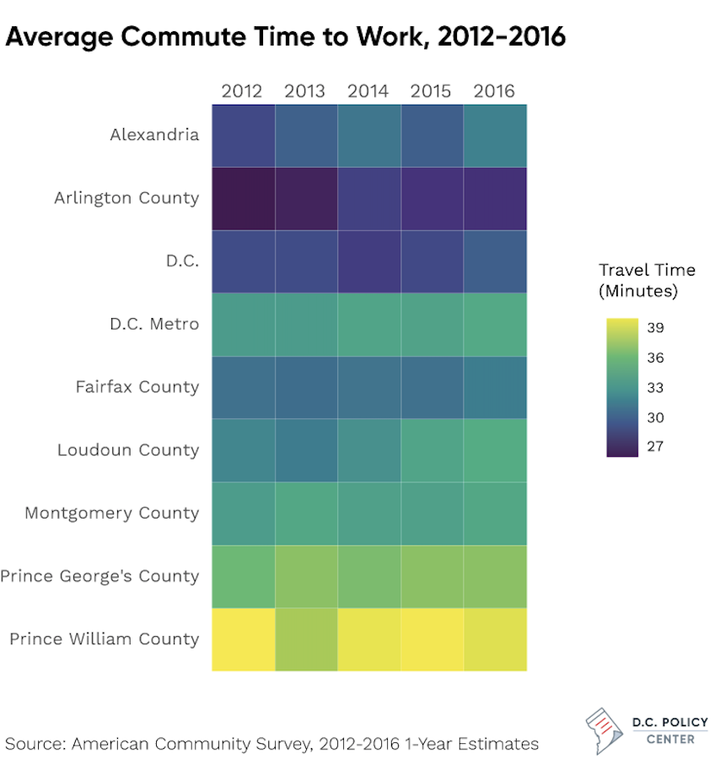
Description:
A heat chart of the average commute length in selected D.C. metro area jurisdictions (using 2012-2016 5-year ACS data), as created for D.C. Policy Center.
Details:
A heat chart created using ggplot in R. Additional editing completed using Adobe Illustrator.
Simone Roy
Experienced Data Analyst
I am an experienced data analyst with experience in policy, research, and data visualization. I have a background in spatial data analysis and spatial data science.