D.C. Homicides and D.C. Gunshots
 D.C. Homicides and D.C. Gunshots
Description:
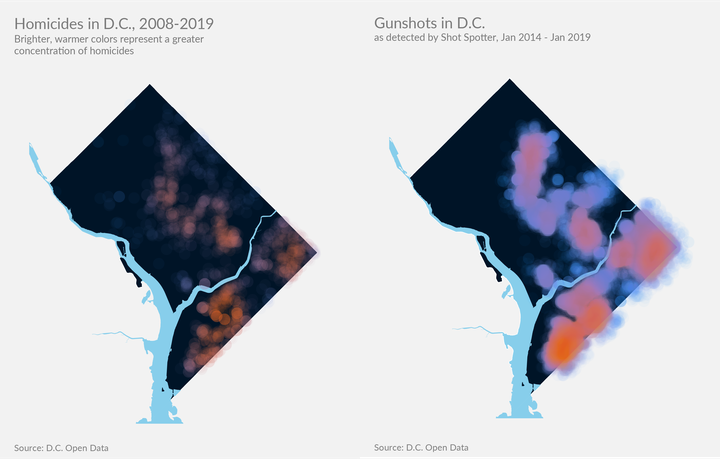
A density map (left) of homicides in D.C. adjacent to a density map (right) of shots fired, as detected by ShotSpotter.
Details:
Maps created in R using the ggplot package. Additional editing completed using Adobe Illustrator.
Simone Roy
Experienced Data Analyst
I am an experienced data analyst with experience in policy, research, and data visualization. I have a background in spatial data analysis and spatial data science.