NCAA Tournament Distribution of Scores by Seed
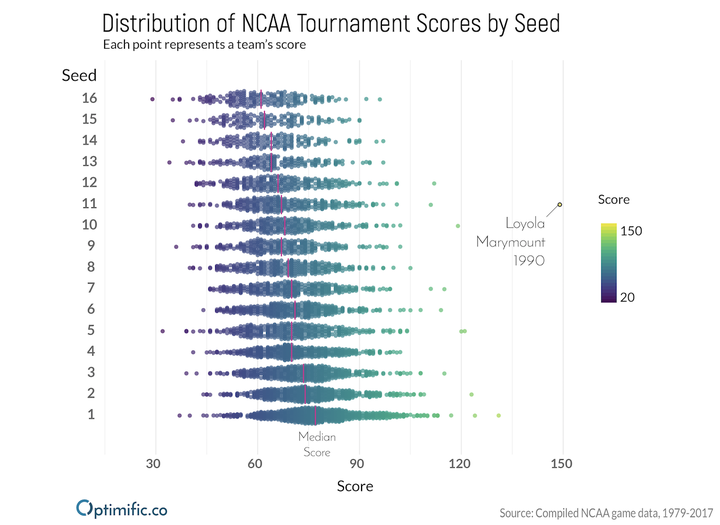
 NCAA Tournament Distribution of Scores by Seed
Description:
A beeswarm chart showing the distribution of scores in the NCAA tournament by seed.
Details:
A beeswarm chart created in R using ggplot and ggbeeswarm packages. Additional editing was completed using Adobe Illustrator.