Simone Roy
Experienced Data Analyst
Biography
I have extensive experience with data analysis and data visualization, with particularly strong experience working in R. I am a 2024 graduate of Pennsylvania State University with a Master of Science in spatial data science. In 2022, I earned a certificate in geographic information systems from Pennsylvania State University. Previously, I earned my Bachelor of Arts in sociology with a minor in government from Georgetown University. I have worked in policy and research positions, with experience in research design and analysis.
My portfolio highlights some of my data visualization work.
Portfolio
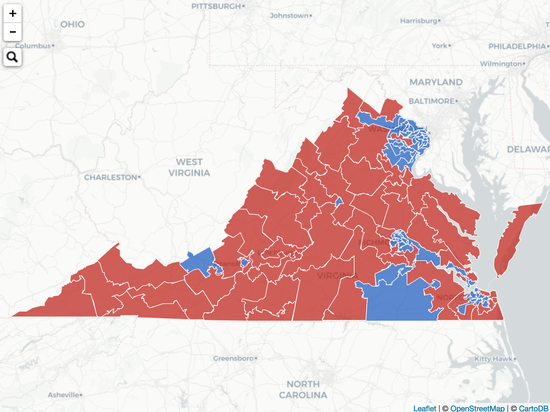
State Legislature Maps - Virginia
State Legislature Maps - Virginia
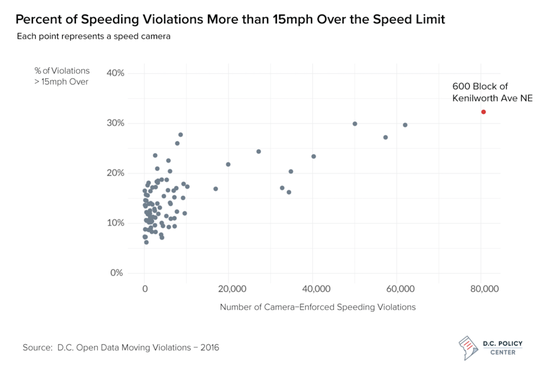
D.C. Speeding Violations Greater Than 15 mph Over the Speed Limit
D.C. Speeding Violations Greater Than 15 mph Over the Speed Limit

Change in Heavy and Light Rail Ridership by Transit System
Change in Heavy and Light Rail Ridership by Transit System, as created for D.C. Policy Center.
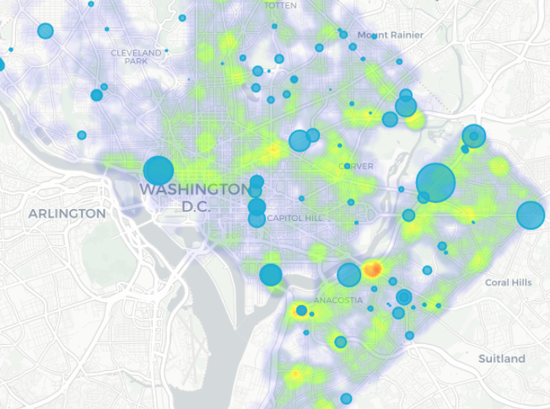
Speed cameras in D.C. [External Link]
Speed cameras in D.C. - Post for D.C. Policy Center blog
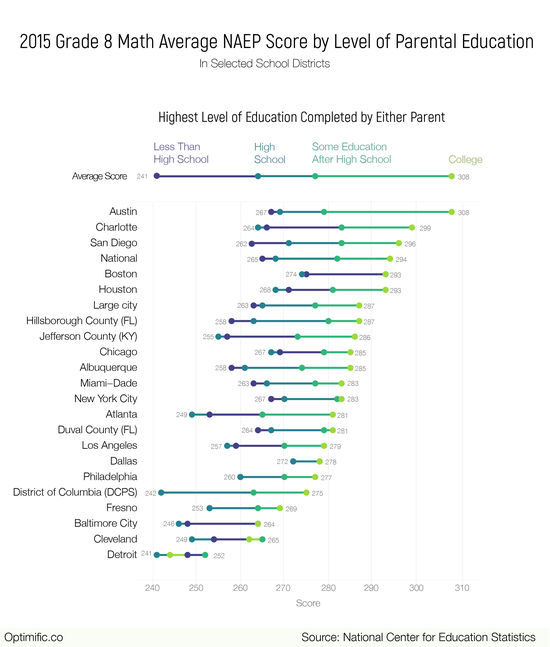
2015 Grade 8 Math NAEP Scores by Parental Education
2015 Grade 8 Math NAEP Scores by Parental Education
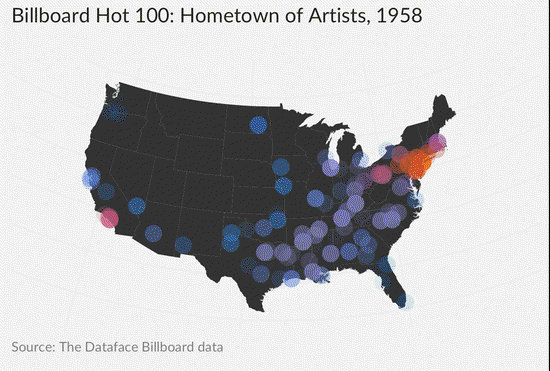
Billboard Hot 100 Artist Hometowns Over Time
Billboard Hot 100 Artist Hometowns Over Time
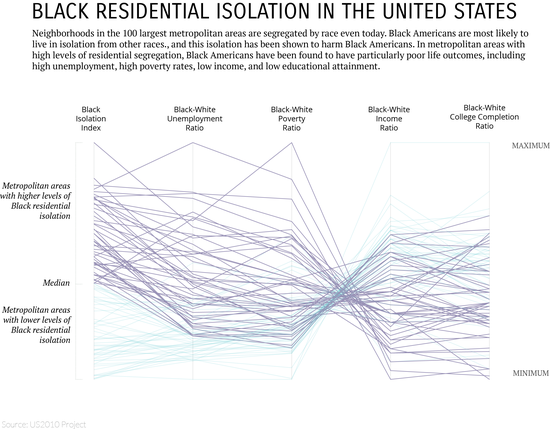
Black Residential Isolation in the United States
Black Residential Isolation in the United States
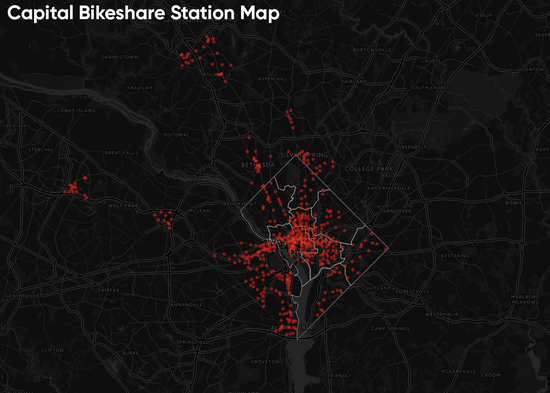
Capital Bikeshare Station Map
Map of Capital Bikeshare Stations (as of 12/2017).
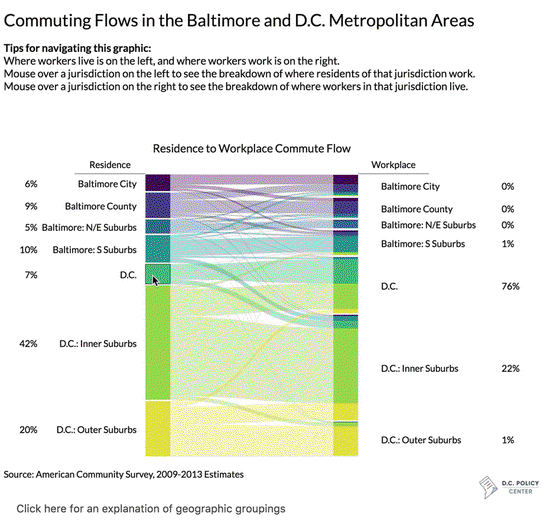
D.C. and Baltimore Commute Flows, as created for D.C. Policy Center.
D.C. and Baltimore Commute Flows, as created for D.C. Policy Center.
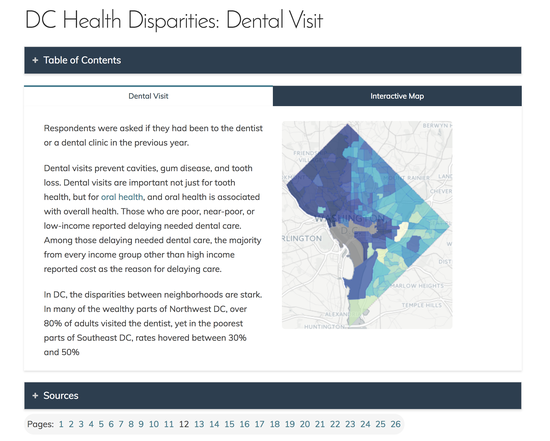
D.C. Health Disparities - Map of Dental Visits
D.C. Health Disparities - Map of Dental Visits
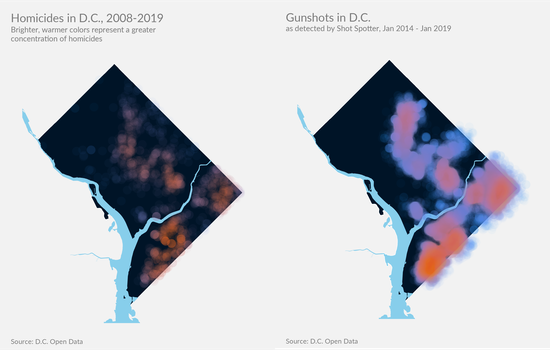
D.C. Homicides and D.C. Gunshots
D.C. Homicides and D.C. Gunshots
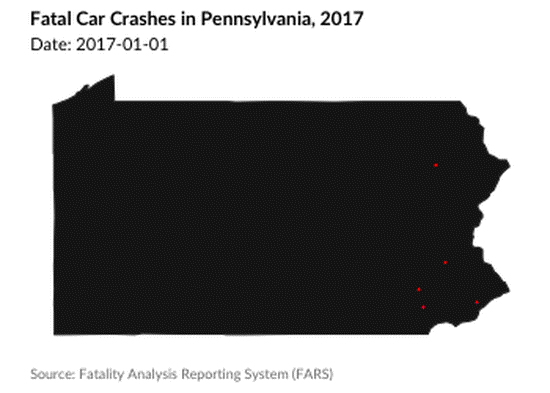
Fatal Crashes in PA, 2017
Animated chart showcasing each fatal crash in Pennsylvania in 2017.
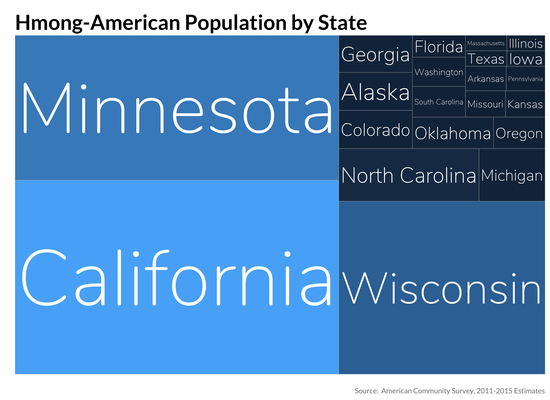
Hmong Population by State
Hmong Population by State
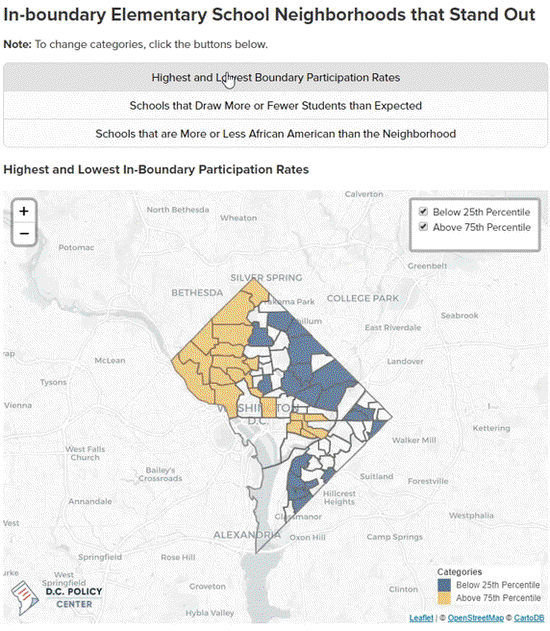
In-Boundary Elementary School Neighborhoods that Stand Out
In-Boundary Elementary School Neighborhoods that Stand Out
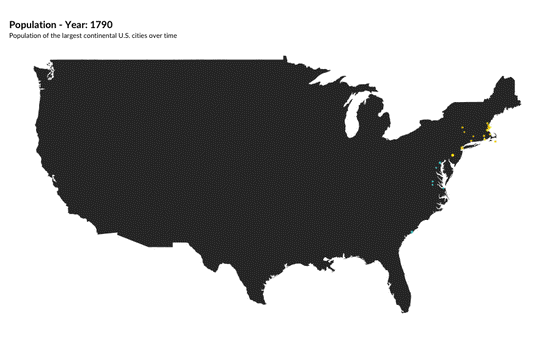
Map - Largest U.S. Cities, 1790 - 2017
Map - Largest U.S. Cities, 1790 - 2017
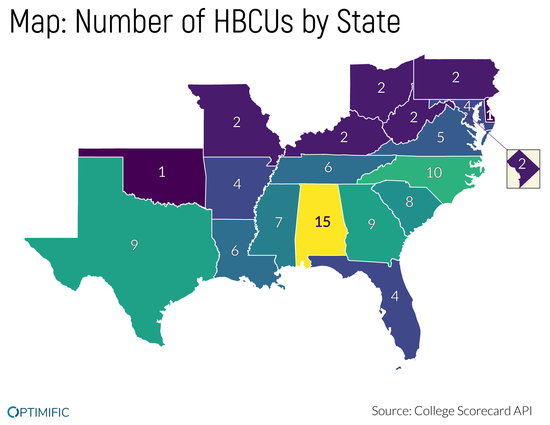
Map - Number of HBCUs by State
Map - Number of HBCUs by State
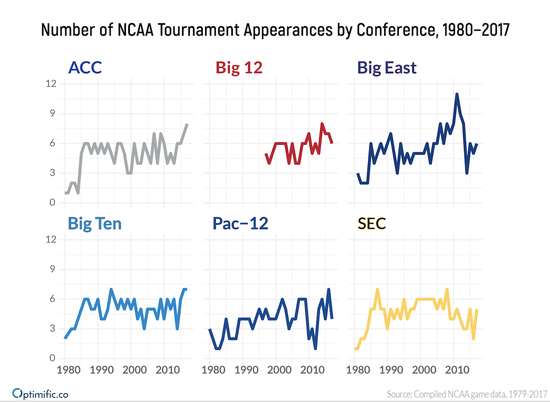
NCAA Tournament Appearances by Conference
NCAA Tournament Appearances by Conference
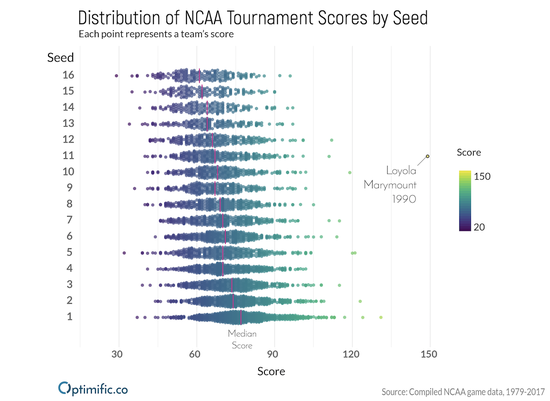
NCAA Tournament Distribution of Scores by Seed
NCAA Tournament Distribution of Scores by Seed
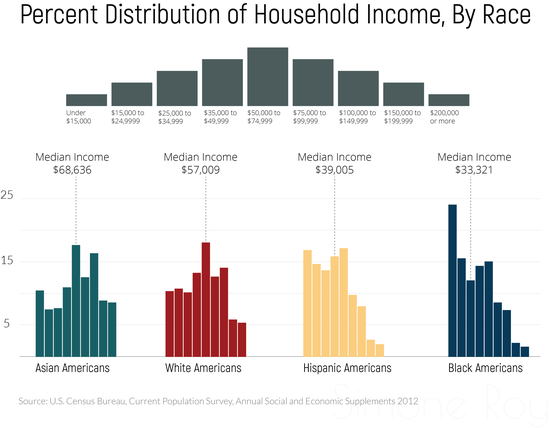
Percent Distribution of Household Income by Race
Percent Distribution of Household Income by Race
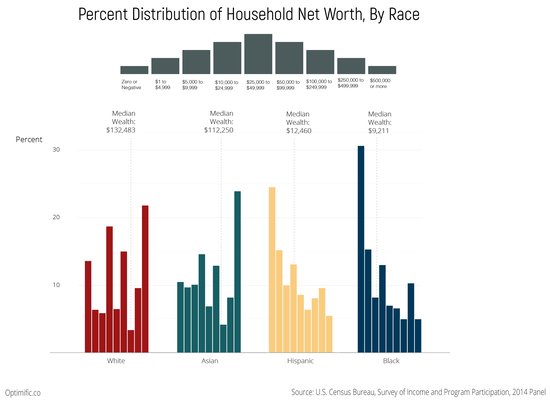
Percent Distribution of Household Wealth by Race
Percent Distribution of Household Wealth by Race
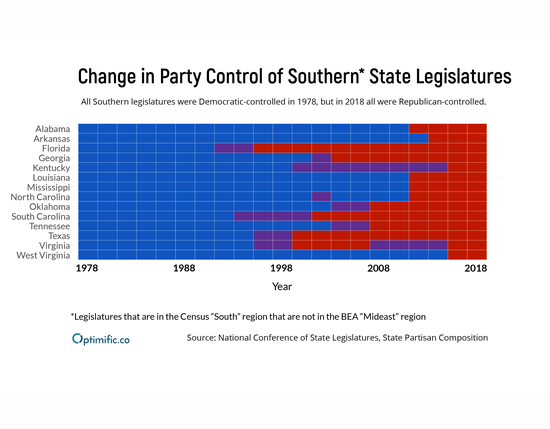
Change in Party Control of Southern State Legislatures
Change in Party Control of Southern State Legislatures
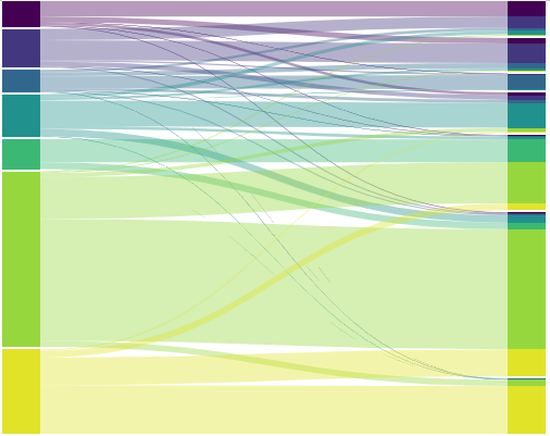
How many people commute between Baltimore and D.C.? [External Link]
How many people commute between Baltimore and D.C.? - Post for D.C. Policy Center blog
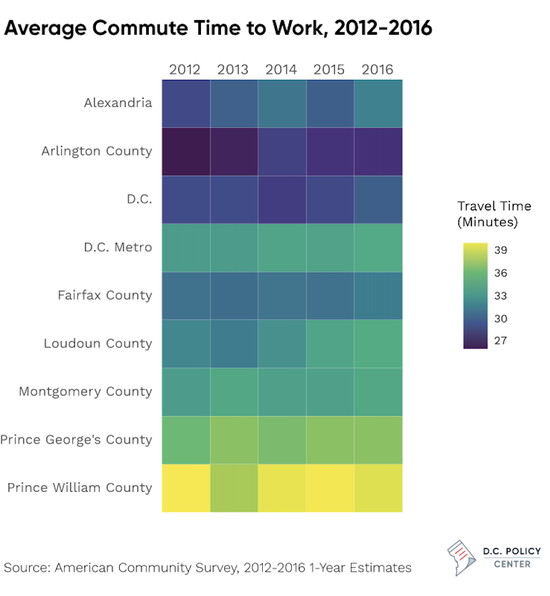
Average D.C. Metro Area Commute Lengths, 2016
A heat chart of the average commute length in selected D.C. metro area jurisdictions (using 2012-2016 5-year ACS data), as created for D.C. Policy Center.